Spot · whole-slide · atlas
Spatial molecular reasoning from routine histology
HistAgent combines a visual-omics foundation model with a spatial agentic module to support spatial molecular analysis, interactive biological analysis, whole-slide clinical prediction and atlas-scale retrieval.
No sign-in required. Start with the public example or your own image.
Reproduce the analyses with our tutorials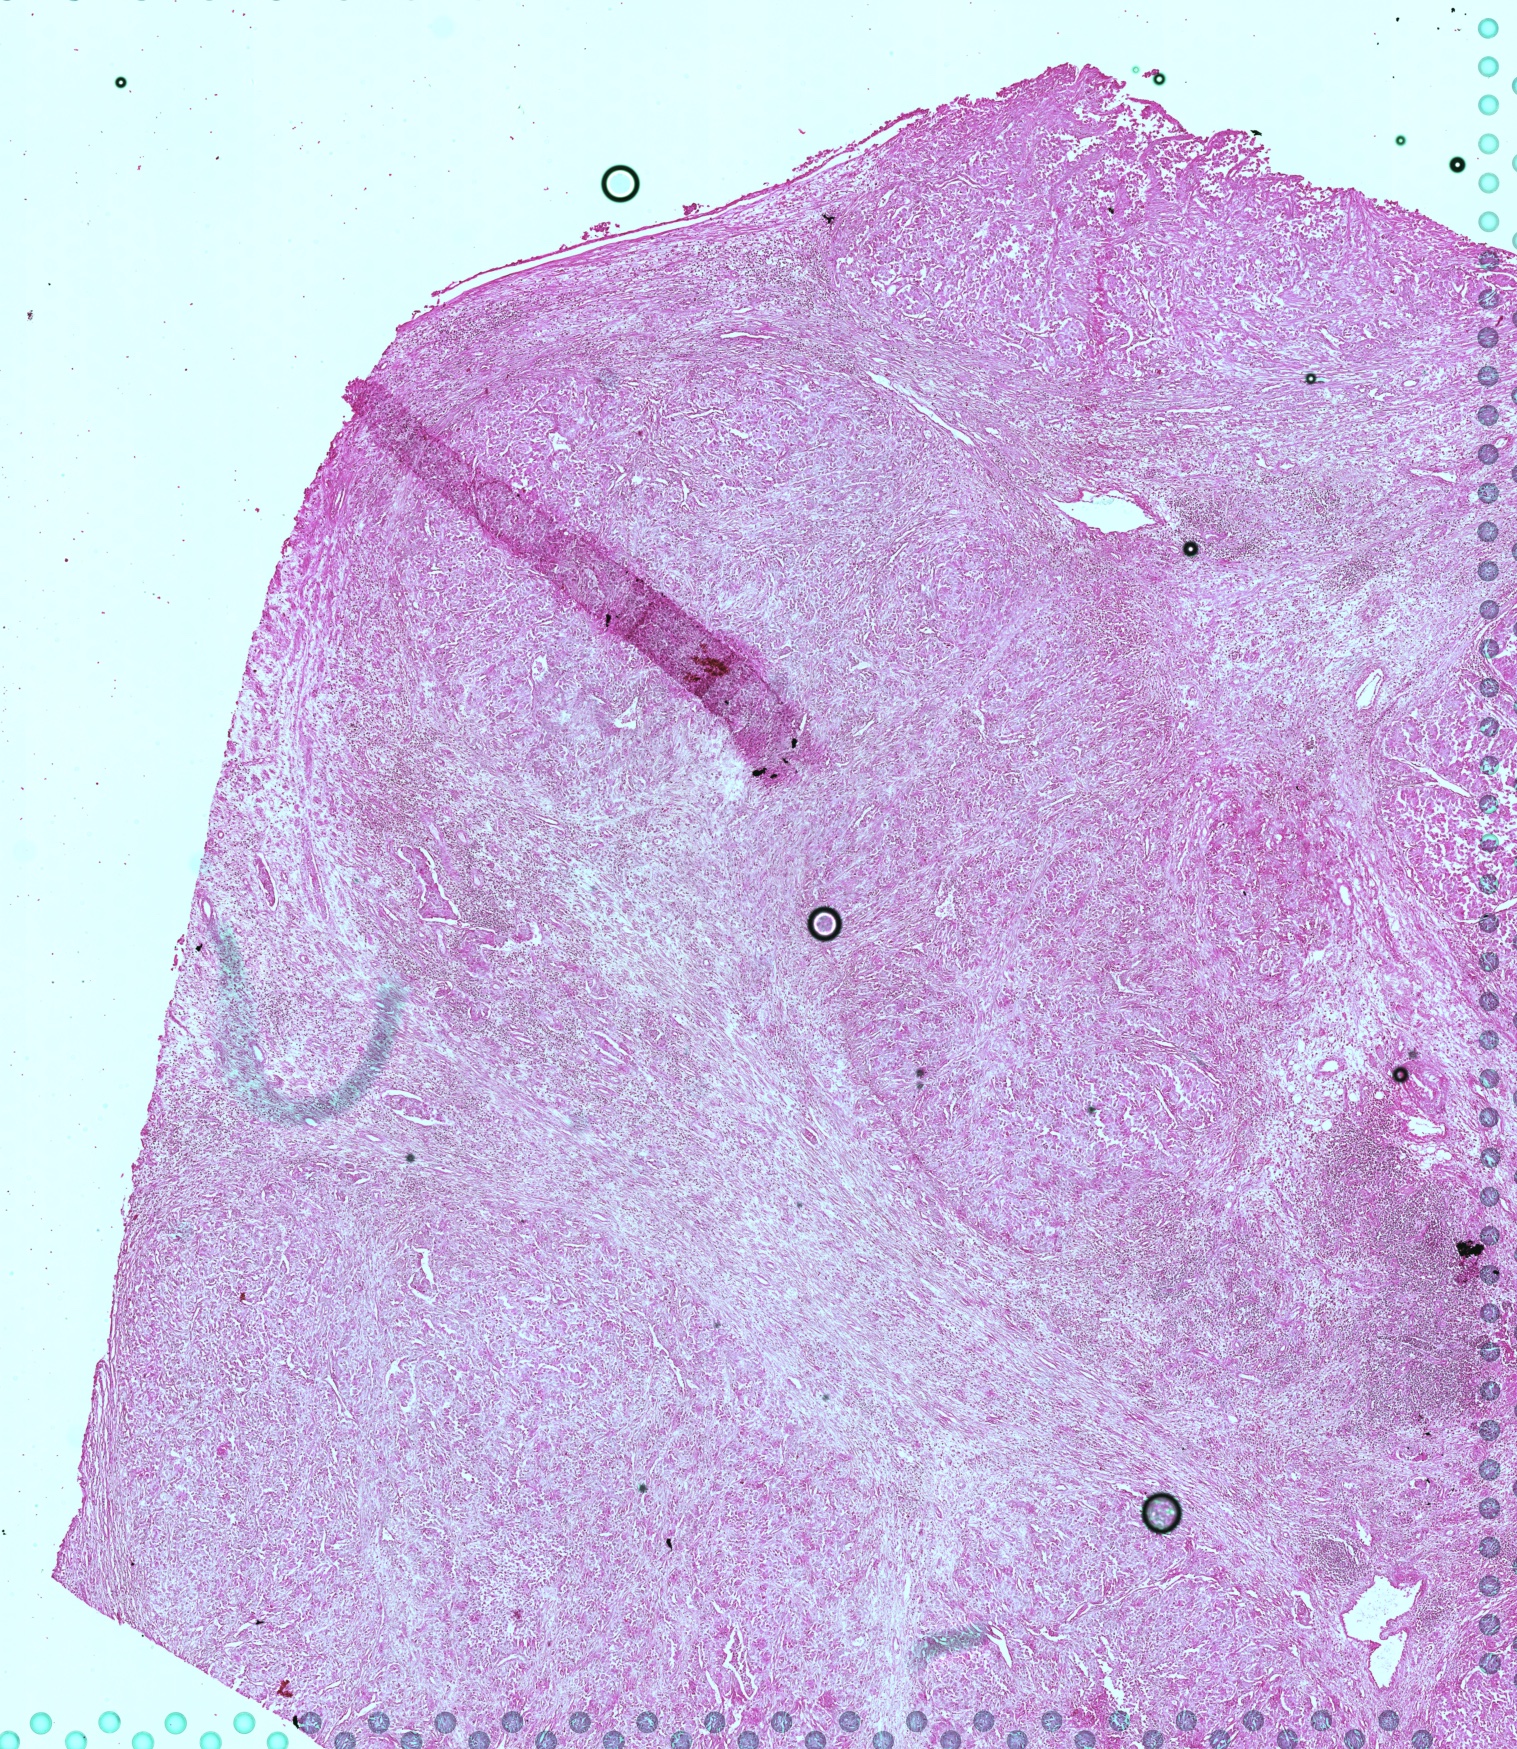
HistAgent localizes and interprets a TLS-like immune niche.
- 2.23Mpaired H&E–ST spots
- 936human and mouse slides
- 32tissue categories
- 50,000evidence-reasoning traces
Interactive workspaces
Start with tissue.
Follow the evidence.
Analyze a selected tissue location, or retrieve related molecular states from the measured spatial transcriptomics evidence bank.
Analyze selected tissue locations
Use local and contextual H&E views to examine a selected tissue location through interactive, multi-turn analysis.
Analyze tissue Atlas ExplorerExplore measured ST atlases
Use natural-language or H&E image queries to retrieve related molecular states and continue with retrieval-grounded analysis.
Explore AtlasReproduce the manuscript analyses
Five notebooks cover spatial biological findings, molecular recovery and ST analyses, clinical prediction and atlas retrieval.
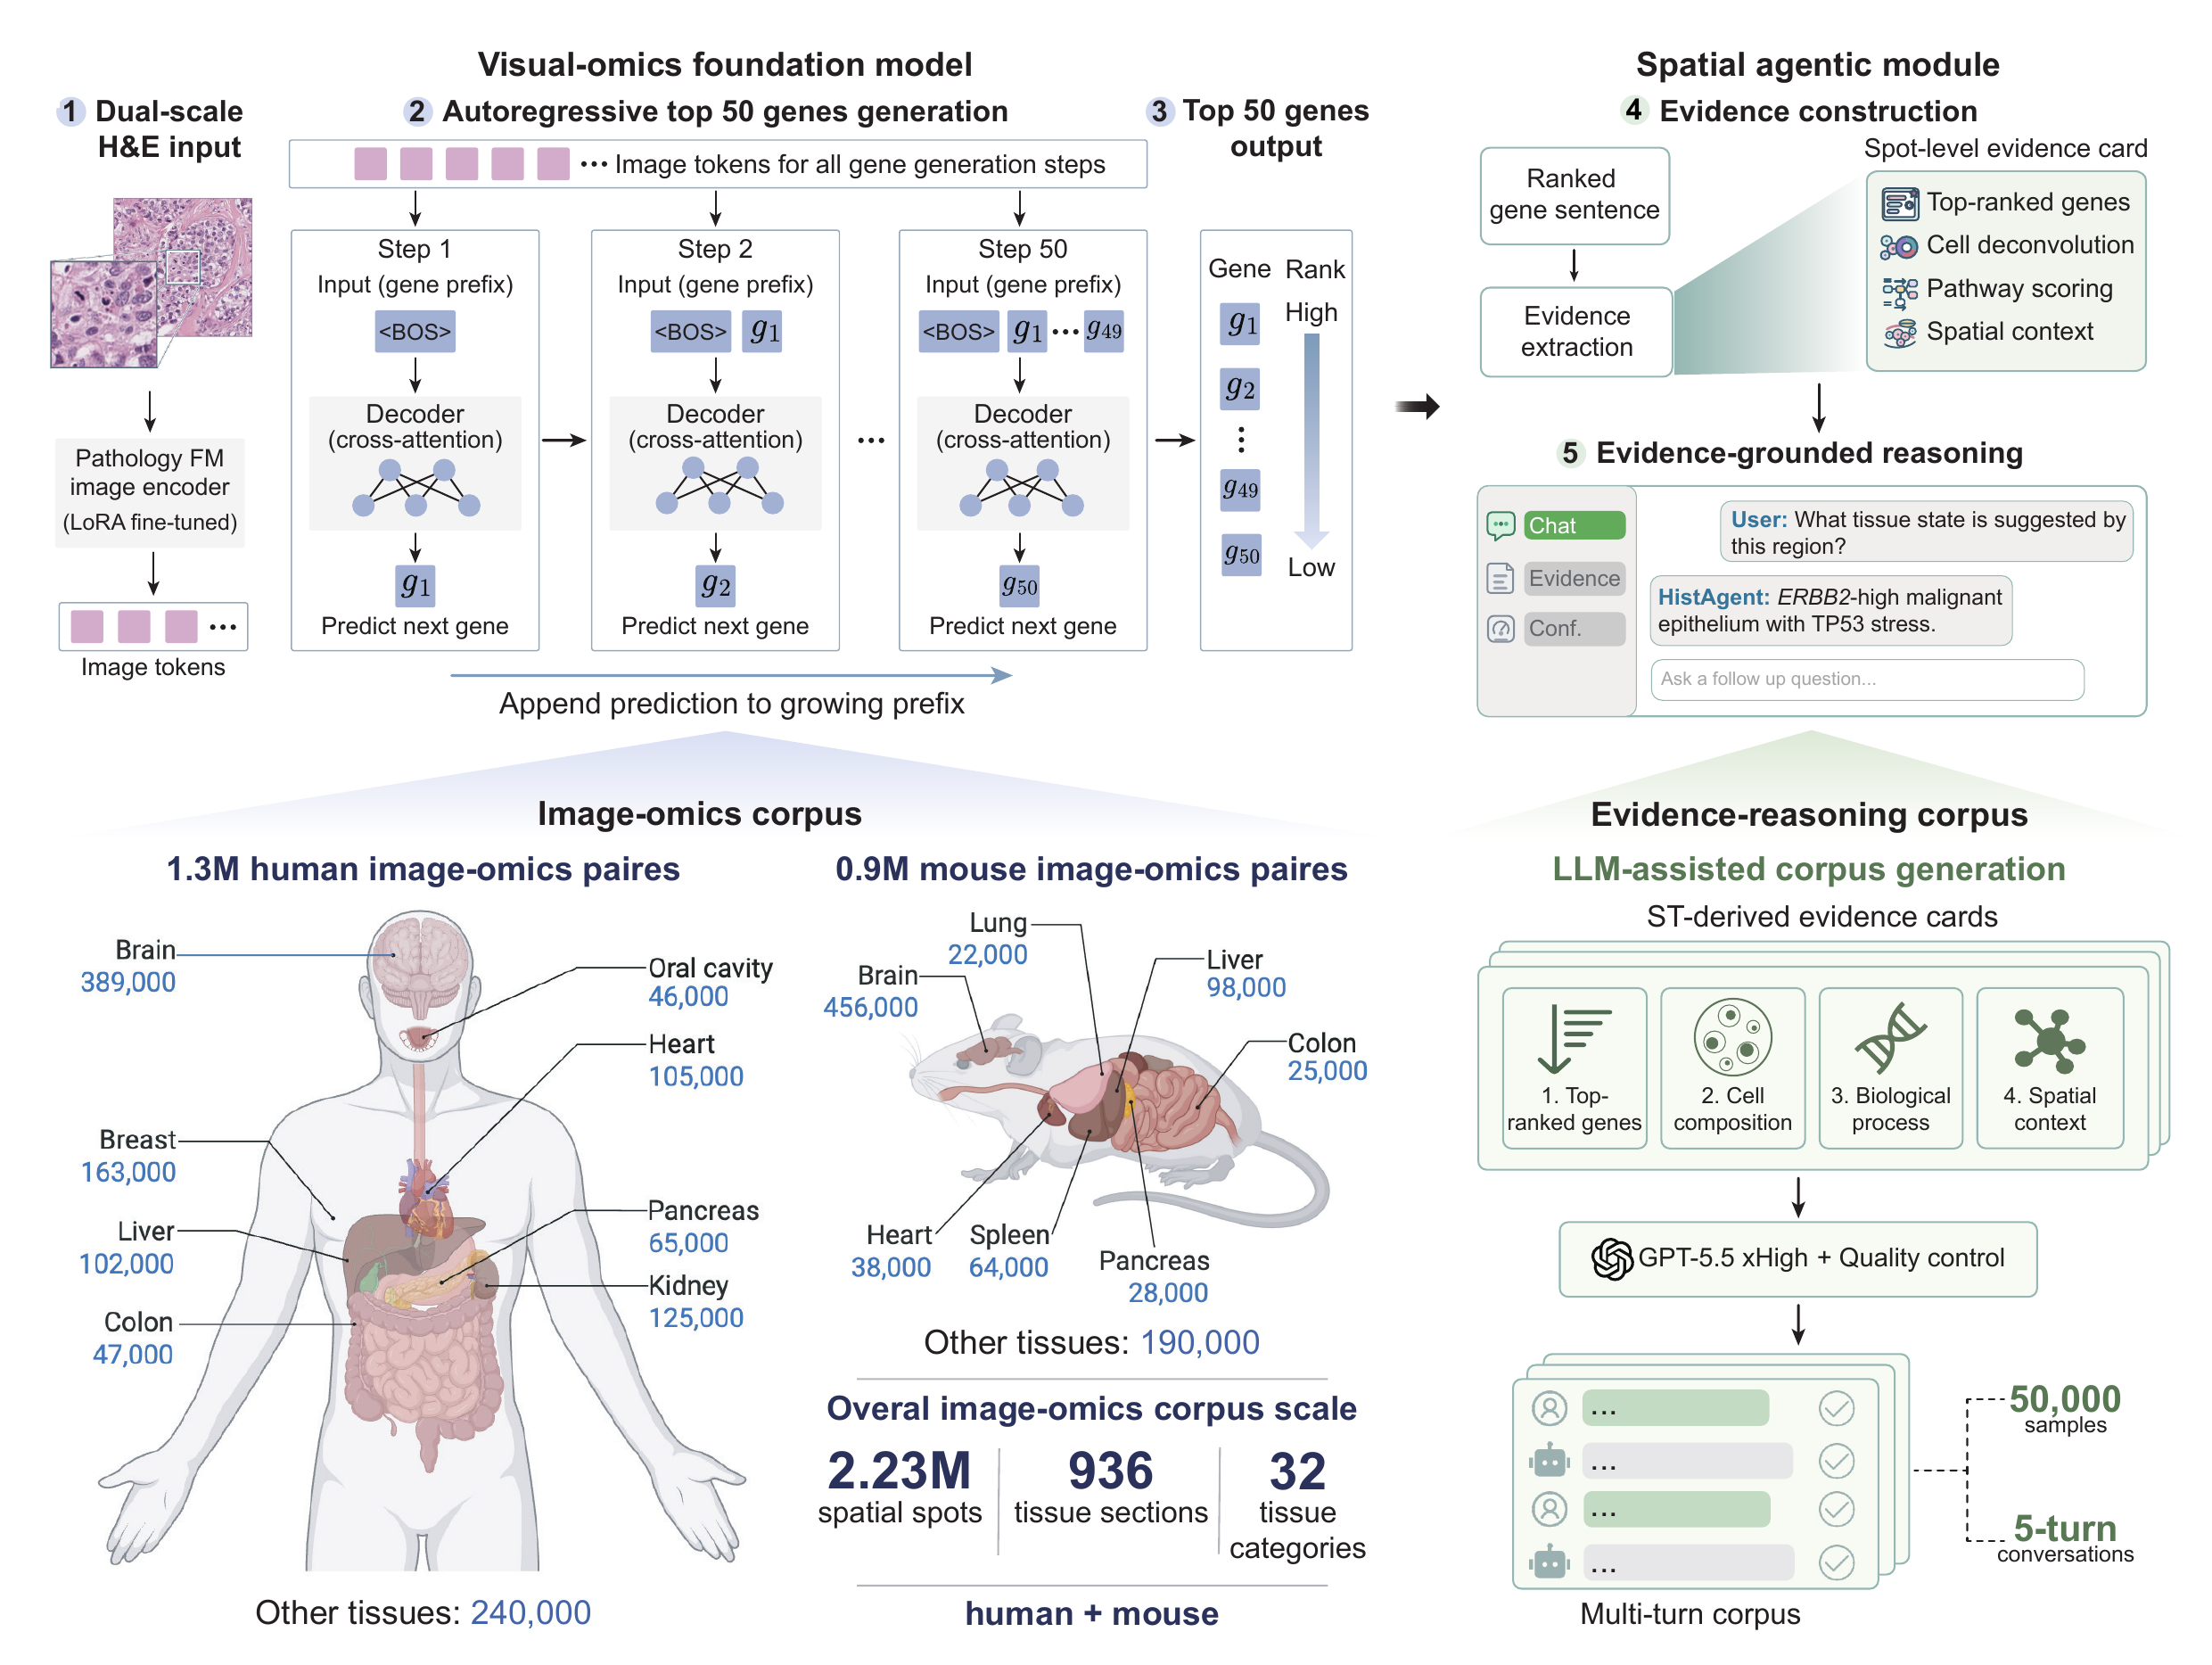
Method at a glance
A unified framework for spatial molecular analysis
HistAgent couples a visual-omics foundation model with a spatial agentic module to connect local and contextual H&E morphology with question-driven analysis of local tissue states.
- Local and contextual H&E
The foundation model jointly encodes a selected tissue location and its surrounding tissue context.
- Spatial molecular analysis
HistAgent recovers spatial biological findings and supports standard ST analyses from routine histology.
- Interactive biological analysis
The spatial agentic module selects and integrates question-relevant molecular and spatial evidence across multiple turns.
- Cross-scale applications
HistAgent extends from spot-level analysis to whole-slide clinical prediction and retrieval from a measured ST evidence bank.
Runnable notebooks
Five tutorials
Each notebook combines explanation, runnable code and outputs. Pretrained models are provided where training would take too long for a tutorial.
-
Generate and evaluate ranked molecular readouts
Calculate spot-level gene-ranking recovery and gene-level spatial recovery across five held-out slides.
-
Analyze spatial biological findings
Compare predicted and measured expression, localize an RCC TLS-like niche and review cross-study finding recovery.
-
Run standard spatial transcriptomic analyses
Run SVG detection, spatial domain identification, deconvolution, differential expression and pathway enrichment.
-
Interpret whole-slide clinical predictions
Inspect tissue regions associated with slide-level predictions and compare patient-level risk groups.
-
Search the spatial transcriptomics atlas
Explore measured tissue locations and run representative natural-language and H&E image queries.